Mrk307分光データの整約
練習用データは馬渡健のサブページ/データ倉庫にある。
必要なデータが入ってるディレクトリ:IRAF_sp_practice
中はとりあえず
$ ls
BIAS_Sp COMP_Sp FLAT_Sp M307_Sp STD_Sp mrk307_spectroscopy.tar
☆事前準備
=下調べ
◎M307_Sp内にて
(Subaru/FOCASの画像はcoordinate systemが変?→後で面倒臭くならないように最初にresetしておく)
まずはwcsreset
cl> wcsreset * wcs="world"
cl> imhe *
FCSA00066152.fits[1023,199][ushort]: Mrk307
FCSA00066158.fits[1023,199][ushort]: Mrk307
FCSA00066160.fits[683,4095][ushort]: Mrk307
FCSA00066162.fits[683,4095][ushort]: Mrk307
cl> hselect * "frameid,object,slit,exptime" yes
FCSA00066152 Mrk307 SCFCSLLC08 2.5
FCSA00066158 Mrk307 SCFCSLLC08 30.0
FCSA00066160 Mrk307 SCFCSLLC08 900.0
FCSA00066162 Mrk307 SCFCSLLC08 900.0
→displayさせたりすれば分かるが、
積分時間の長いFCSA00066160.fitsとFCSA00066162.fitsがじっさいにとったスペクトルで、
FCSA00066152.fitsとFCSA00066158.fitsはスリットごしのMrk307画像になってる。
◎BIAS_Sp内にて
まずはwcsreset
cl> wcsreset * wcs="world"
cl> hselect FCSA* "frameid,object,slit" yes
FCSA00065940 BIAS SCFCMS0344
FCSA00065942 BIAS SCFCMS0344
FCSA00065944 BIAS SCFCMS0344
FCSA00065946 BIAS SCFCMS0344
FCSA00065948 BIAS SCFCMS0344
FCSA00065950 BIAS SCFCMS0344
FCSA00065952 BIAS SCFCMS0344
FCSA00065954 BIAS SCFCMS0344
FCSA00065956 BIAS SCFCMS0344
FCSA00065958 BIAS SCFCMS0344
cl> imstat *
# MEAN MAX MIN
11706. 47192. 0.
11706. 40733. 0.
11706. 38733. 0.
11705. 41311. 0.
11701. 38831. 0.
11702. 43995. 0.
11701. 39081. 0.
11701. 40289. 0.
11701. 39914. 0.
11700. 38852. 0.
→全部等価なBIAS画像っぽい
◎FLAT_Sp内にて
まずはwcs reset
cl> wcsreset * wcs="world"
cl> imhe *
FCSA00066330.fits[683,4095][ushort]: DOMEFLAT
FCSA00066332.fits[683,4095][ushort]: DOMEFLAT
FCSA00066334.fits[683,4095][ushort]: DOMEFLAT
FCSA00066336.fits[683,4095][ushort]: DOMEFLAT
FCSA00066338.fits[683,4095][ushort]: DOMEFLAT
cl> hselect * "frameid,object,slit,exptime" yes
FCSA00066330 DOMEFLAT SCFCSLLC08 4.5
FCSA00066332 DOMEFLAT SCFCSLLC08 4.5
FCSA00066334 DOMEFLAT SCFCSLLC08 4.5
FCSA00066336 DOMEFLAT SCFCSLLC08 4.5
FCSA00066338 DOMEFLAT SCFCSLLC08 4.5
→全部等価のドームフラット画像っぽい
◎COMP_Sp内にて(波長calibrationのためのフレーム"compalison"がはいったディレクトリ)
まずはwcsreset
cl> wcsreset * wcs="world"
cl> imhe *
FCSA00066344.fits[683,4095][ushort]: COMPARISON
FCSA00066346.fits[683,4095][ushort]: COMPARISON
FCSA00066354.fits[683,4095][ushort]: COMPARISON
FCSA00066356.fits[683,4095][ushort]: COMPARISON
cl> hselect * "frameid,object,slit,exptime" yes
FCSA00066344 COMPARISON SCFCSLLC08 1.0
FCSA00066346 COMPARISON SCFCSLLC08 1.0
FCSA00066354 COMPARISON SCFCSLLC08 1.0
FCSA00066356 COMPARISON SCFCSLLC08 1.0
displayもさせてみる
→FCSA00066344.fits,354.fitsが明るくさちったりしてるのに対して
FCSA00066346.fits,356.fitsはさちったりはしてない。
これはわざとこうしてて後で必要に応じて使い分けたりするので注意
◎STD_Sp内にて(分光標準星)
まずはwcsreset
cl> wcsreset * wcs="world"
cl> imhe *
FCSA00066182.fits[683,4095][ushort]: G191B2B
cl> hselect * "frameid,object,slit,exptime" yes
FCSA00066182 G191B2B SCFCSLLC20 60.0
◎気づいたこと
・フォーマット
全部[683,4095]でそろってる
・スリット
M307,FLAT,COMPはSCFCSLLC08でそろっているし、STDのSCFCSLLC20はそのスリット幅が違う(幅広い)だけと思われる。
BIASはSCFCMS0344で違うが、CCDの特性で積分時間0秒のデータなので問題にならない。
☆BIAS引き
◎平均BIASフレームの作成
(BIAS_Spに入って)
・リスト化
$ ls > BIAS_list
・imcombine
cl> imcombine @BIAS_list medianBIAS.fits combine="median"
◎天体画像からこの平均BIASフレームを引く
・M307_Spにコピー
$ cp medianBIAS.fits /media/HD-CEU2/IRAF_sp_practice/M307_Sp/
(M307_Spに入って)
・天体スペクトルFCSA00066160.fits、FCSA00066162.fitsからmedianBIAS.fitsを引く
cl> imarith FCSA00066160.fits - medianBIAS.fits subBIAS160.fits
cl> imarith FCSA00066162.fits - medianBIAS.fits subBIAS162.fits
☆FLATフィールディング
◎BIASフレームをFLAT_Spに移動
$ cp medianBIAS.fits /media/HD-CEU2/IRAF_sp_practice/FLAT_Sp/
(FLAT_Spに入って)
◎平均FLATフレームの作成
・リスト化
$ ls > FLAT_list (imarithの入力用)
$ awk '{print "medianBIAS.fits"}' FLAT_list > medianBIAS_list (imarithの入力用)
$ awk '{print "subBIAS_FLAT"substr($1,10,20)}' FLAT_list > subBIAS_FLAT_list (imarithの出力用)
・BIAS引き
cl> imarith @FLAT_list - @medianBIAS_list @subBIAS_FLAT_list
(これでBIAS引いたFLATフレームsubBIAS_FLAT???.fitsができたのでこれらの平均フレームをつくる)
・imcombine
cl> imcombine @subBIAS_FLAT_list medianFLAT.fits combine="median"
(このFLATフレームで確かに感度ムラはわかるが、countが大きいので平均カウントが1になるように規格化する)
・ピクセルカウントの平均が1になるように規格化
ecl> imstat medianFLAT.fits
# IMAGE MEAN MIDPT STDDEV NPIX
medianFLAT.fits 8633. 8892. 4970. 2796885
→medianFLAT.fitsの平均値は8633
ecl> imarith medianFLAT.fits / 8633 normFLAT.fits
ecl> imstat normFLAT.fits fields="image,mean,midpt,stddev"
# IMAGE MEAN MIDPT STDDEV
normFLAT.fits 0.9999 1.03 0.5759
◎FLATで天体画像をわる
・M307_Spにコピー
$ cp normFLAT.fits /media/HD-CEU2/IRAF_sp_practice/M307_Sp/
(M307に入って)
cl> imarith subBIAS160.fits / normFLAT.fits fl160.fits
cl> imarith subBIAS162.fits / normFLAT.fits fl162.fits
ここまででBIAS引き、FLATフィールディング済んだスペクトルフレーム
fl160.fits、fl162.fits
が得られた
☆波長校正(wavelength calibration)
・・・FCSA00066346.fits(長波長側の強輝線用)とFCSA00066344(短波長側の弱輝線用)とを組み合わせて使う。
(COMP_Spに入って)
◎コンパリソンのBIAS引き、FLATわり
・BIAS、FLATフレームのコピー
$ cp ../BIAS_Sp/medianBIAS.fits ./
$ cp ../FLAT_Sp/normFLAT.fits ./
・BIAS引き
ecl> imarith FCSA00066346.fits - medianBIAS.fits hoge_subB346.fits
ecl> imarith FCSA00066344.fits - medianBIAS.fits hoge_subB344.fits
・FLATわり
ecl> imarith hoge_subB346.fits / normFLAT.fits Arc346.fits
ecl> imarith hoge_subB344.fits / normFLAT.fits Arc344.fits
◎コンパリソンフレームの輝線の波長同定
・必要なデータの取得
Th-Arラインの波長がかかれたテキストファイルfocas_m307_thar_all.datとfocas_m307_thar.datをサブページのデータ倉庫からとってくる。(保存場所はCOMP_Spで)
またすばる望遠鏡/FOCAS/User's manual
でTh-Arのスペクトルを確認。
・目視による波長同定と準備
cl> display Arc346.fits 1 →二次元スペクトル
cl> implot Arc346.fits
cl> implot Arc344.fits
適当なcolumn(400くらいで"c",yレンジの指定":y -1000 4000",SN比の向上":c 390 410")
→x=390~410における一次元スペクトル→Arc346、Arc344
これらと正確なTh-Arのスペクトルを見比べて二次元(一次元)スペクトルの輝線の内、
数本の波長を目で同定しておく。
(→5720.1828,5760.5508,7067.2181,7383.9805,7503.8691,7514.6518,7635.1060が同定できた)
また、詳細に見てみた結果、y<1250ではArc346.fitsを,y>1250ではArc344.fitsを使うのが妥当と思われた。(Arc346.fitsの右側は輝線が弱すぎ、Arc344.fitsの左側はサチって信用できない)
→上手く足し合わせる。
(例)ecl> imarith Arc344.fits * 0.08 hoge_arc344.fits (二つの画像は感度が全然違うので感度の良い344の方を適当に小さくしとく)
ecl> imcopy Arc346.fits hogeArc.fits
ecl> imcopy hoge_arc344.fits[*,1250:4095] hogeArc.fits[*,1250:4095]
更に上手く輝線の波長同定できそうな領域だけを切り出す。object画像(fl160.fits,fl162.fits),Std画像(FCSA00066182.fits)を見る限りx=201~560の領域だけあれば十分っぽいので、hogeArc.fitsから[201:560,0:3800]だけ切り出す。
ecl> imcopy hogeArc.fits[201:560,0:3800] goodArc.fits
スペクトル見てみると
ecl> implot goodArc.fits →よさげ
◎コンパリソンフレームを用いて波長-ピクセルの対応関係つくる
・あるcolumnで「ピクセル→波長」への変換関係式の導出(identify)
パッケージnoao.two.longslitに入る
cl> two
twodspec> lo
longslit> epar identify
I R A F
Image Reduction and Analysis Facility
PACKAGE = onedspec
TASK = identify
images = goodArc.fits Images containing features to be identified #対象となる二次元スペクトル#
(section= [200,*]) Section to apply to two dimensional images #どのcolumnまたはlineで縦ぎりにした一次元スペクトルをつくるか指定#
(databas= database) Database in which to record feature data #ピクセル→波長の変換データの出力ディレクトリ#
(coordli= focas_m307_thar.dat ) User coordinate list #元々ある輝線リストをここに入力#
(units = ) Coordinate units
(nsum = 10) Number of lines/columns/bands to sum in 2D image #(たぶん)x=195から205までのピクセルのカウントを足し合わせ、という意味・・・#
(match = -5.) Coordinate list matching limit #スペクトル座標とcoodliを合わせる変換式をつくるときに何ピクセルまでのズレを許すかということ?#
(maxfeat= 50) Maximum number of features for automatic identif #coordliのうち強い順に何本まで使うか#
(zwidth = 100.) Zoom graph width in user units
(ftype = emission) Feature type #absorptionも選べる#
(fwidth = 1.) Feature width in pixels #検出する輝線の幅の最小値#
(cradius= 7.) Centering radius in pixels #最初にマークした推定箇所はこれよりも本当の輝線箇所に近くにないと認識できない#
(thresho= 0.) Feature threshold for centering #スペクトルの連続部がこの値だと思って、thresholdを基準にfeature検出を行う。ちゃんとbias引き、flat-fieldingなされていれば0でいい。#
(minsep = 2.) Minimum pixel separation #これより離れた輝線は分離して認識できる#
(functio= spline3) Coordinate function #どういう関数系でfitするか?chebyshev,legendre,spline1,spline3が選択できる#
(order = 6) Order of coordinate function #何次でfitするか?今は3次#
(sample = *) Coordinate sample regions
(niterat= 0) Rejection iterations
(low_rej= 3.) Lower rejection sigma
(high_re= 3.) Upper rejection sigma
(grow = 0.) Rejection growing radius
(autowri= no) Automatically write to database
(graphic= stdgraph) Graphics output device
(cursor = ) Graphics cursor input
crval = Approximate coordinate (at reference pixel)
cdelt = Approximate dispersion
(aidpars= ) Automatic identification algorithm parameters
(mode = ql)
(:go)
さらに出てきたx=200での一次元スペクトルの上で
"shift"+"x"又は"shift"+"y"
で目で波長同定した輝線(例えば7635.1060)を拡大し
"m"
でマーク。その状態で7635.1060とうち"Enter"
→一本が同定された。
zoom解除は"z"+"p"で
これを先に目視した数本で行う。(バランス良く4、5本やる。ここの作業が成功失敗を分けるので慎重に)
最終的に"l"とうつと→関数fitting
"f"で→残差見れる
"d"で上手くフィッティングできてないやつを消す
上手くフィッテイングできたと思ったら
"q"→"q"で抜ける。データを保存するか聞いてくるので"yes"
→できた情報はdatabase/idgoodArcに保存される
・identifyで作ったデータを元にいろんなcolumnでidentifyを行う(reidentify)
longslit> epar reidentify
I R A F
Image Reduction and Analysis Facility
PACKAGE = longslit
TASK = reidentify
referenc= goodArc.fits Reference image
images = goodArc.fits Images to be reidentified
(interac= no) Interactive fitting? #column毎のidentifyをいちいちチェックしたい場合はyesにする。#
(section= [200,*]) Section to apply to two dimensional images #このsectionの前後からidentifyを始める。identifyを行ったcolumnに合わせる。#
(newaps = yes) Reidentify apertures in images not in reference?
(overrid= no) Override previous solutions? #基本noで。#
(refit = yes) Refit coordinate function?
(trace = yes) Trace reference image?
(step = 10) Step in lines/columns/bands for tracing an image #次のcolumnに行くときの飛び幅#
(nsum = 10) Number of lines/columns/bands to sum #あるcolumnでidentifyする時、そのcolumnの前後何ピクセルの平均値をとるか?ダメピクセルが悪さしてるときはstep,nsumを工夫したりする。#
(shift = 0.) Shift to add to reference features (INDEF to sea
(search = 0.) Search radius
(nlost = 3) Maximum number of features which may be lost #featureを同定し損ねる時、それを何本まで許すか?#
(cradius= 5.) Centering radius
(thresho= 0.) Feature threshold for centering
(addfeat= no) Add features from a line list? #ラインリストを新たに加えたい場合はyes#
(coordli= linelists$idhenear.dat) User coordinate list #追加リストをここに書く。#
(match = -3.) Coordinate list matching limit #スペクトル座標とcoodliを合わせる変換式をつくるときに何ピクセルまでのズレを許すかということ?#
(maxfeat= 50) Maximum number of features for automatic identif
(minsep = 2.) Minimum pixel separation #これより離れた輝線は分離して認識できる#
(databas= database) Database
(logfile= logfile) List of log files
(plotfil= ) Plot file for residuals
(verbose= no) Verbose output?
(graphic= stdgraph) Graphics output device
(cursor = ) Graphics cursor input
answer = no Fit dispersion function interactively?
crval = Approximate coordinate (at reference pixel)
cdelt = Approximate dispersion
(aidpars= ) Automatic identification algorithm parameters
(mode = ql)
(:go)
→上手く出来たら、database/idgoodArcに情報が書き加えられる。
これでcolumn(xi=x1,x2,x3)毎の波長ピクセル関係式λ(y,xi)=f(y,xi)が出来た。
・reidentifyで作ったcolumn毎の波長ピクセル関係式:λ(y,xi)=f(y,xi)を元に二次元フィッティングを行い、二次元の波長ピクセル関係式:λ(y)=g(x,y)を作る(fitcoord)
ecl> epar fitcoord
I R A F
Image Reduction and Analysis Facility
PACKAGE = longslit
TASK = fitcoords
images = goodArc Images whose coordinates are to be fit #database/idgoodArc内に書かれてるidをここにはインプットすればいいので.fitsはいらない#
(fitname= ) Name for coordinate fit in the database
(interac= yes) Fit coordinates interactively? #ここnoにすると勝手にやっちゃう#
(combine= no) Combine input coordinates for a single fit?
(databas= database) Database
(deletio= deletions.db) Deletion list file (not used if null) #ここにフィッティングから外したデータなどが残って、同じ作業を次回行うときにでしゃばったりするのでなしにしてもいいかも#
(functio= chebyshev) Type of fitting function #二次元フィッティングの関数と#
(xorder = 6) X order of fitting function #xオーダー#
(yorder = 6) Y order of fitting function #yオーダー#
(logfile= STDOUT,logfile) Log files
(plotfil= plotfile) Plot log file
(graphic= stdgraph) Graphics output device
(cursor = ) Graphics cursor input
(mode = ql)
(:go)
実行するとこんなirafterm出てくる。
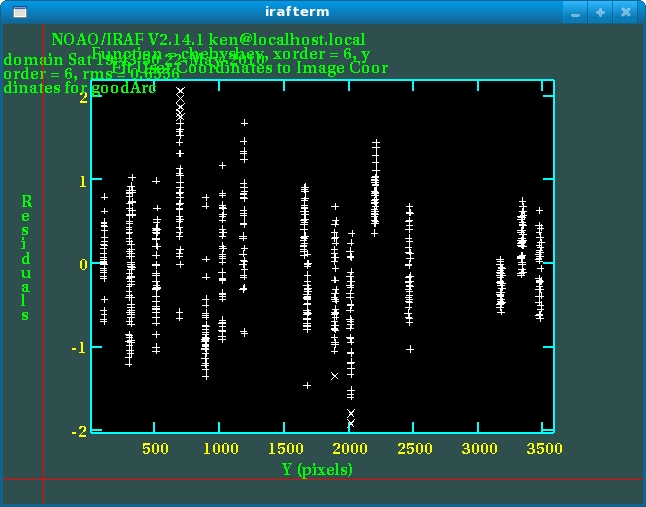
これは二次元関数λ(x,y)=g(x,y)と実際の輝線とのズレを横軸をyにとって表示している。横軸をxにして残差(ズレ)をみたいときは"x"→"x"→"f"と打てば以下のように横軸xのものが表示される。
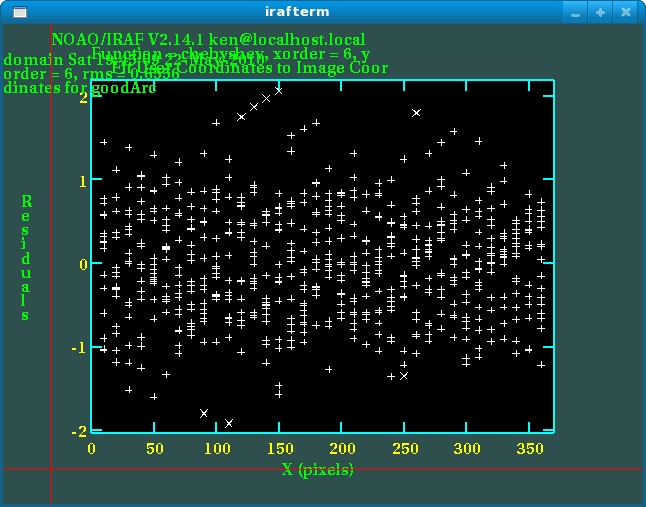
これらの上でフィッティングから外したいデータポイントがあればその点にカーソルを持っていき、"d"→"p"で消せる。
ある程度消せた所でフィッティングしなおすときは"f"。満足したら"q"で終了。
→これで波長-ピクセル関係が二次元関数としてdatabase/fcgoodArcの中に記録された。
◎波長校正(画像変換)
・fitcoordで作った二次元変換法則を用いて実際にコンパリソン画像を画像変換(横軸を波長に)する。(transform)
ecl> epar transform
I R A F
Image Reduction and Analysis Facility
PACKAGE = longslit
TASK = transform
input = goodArc.fits Input images #波長変換前の画像#
output = calArc.fits Output images #波長変換後の出力画像#
(minput = ) Input masks
(moutput= ) Output masks
fitnames= goodArc Names of coordinate fits in the database #変換規則のid#
(databas= database) Identify database
(interpt= spline3) Interpolation type
(x1 = INDEF) Output starting x coordinate
(x2 = INDEF) Output ending x coordinate #ここらへんで強引に出力画像の波長範囲をいじれるが何もしないで上手くいくのがベスト!#
(dx = INDEF) Output X pixel interval
(nx = INDEF) Number of output x pixels
(xlog = no) Logarithmic x coordinate?
(y1 = INDEF) Output starting y coordinate
(y2 = INDEF) Output ending y coordinate
(dy = INDEF) Output Y pixel interval
(ny = INDEF) Number of output y pixels
(ylog = no) Logarithmic y coordinate?
(flux = yes) Conserve flux per pixel?
(blank = INDEF) Value for out of range pixels
(logfile= STDOUT,logfile) List of log files
(mode = ql)
(:go)
結果をdisplayさせて確認すると
こんな感じになる。
もともと使用していた輝線リストfocas_m307_thar.datに5587.0263Åまでしかなく、それ以下の波長の対応づけがなされていないため短波長側がまっすぐにならない可能性もある。
・同じ手法で天体画像を画像変換(横軸を波長に)する。
calArc.fitsがある程度上手くいっていることが確認できたら、同じ波長-ピクセル変換規則をM307_Sp内の天体画像にもかけてやる。
ただしその前にフォーマットがcalArc.fitsと同じになるように[201:560,0:3800]を切り出す。
(M307_Sp内にて)
longslit> imcopy fl160.fits[201:560,0:3800] cor160.fits
longslit> imcopy fl162.fits[201:560,0:3800] cor162.fits
また、コンパリソンのデータベースをM307_Spディレクトリにコピーしてくる。
$ cp -r ../COMP_Sp/database/ ./
実際に画像変換
longslit> transform cor160.fits cal160.fits fitnames=goodArc
longslit> transform cor162.fits cal162.fits fitnames=goodArc
結果をdisplayさせてみると
→cal160.fits,cal162.fits
(☆maskがけ)
どうもx=150あたりにあるbadピクセルが天体光とまじって紛らわしいのでマスクがけしてやる。
◎FLAT画像からmask画像を作る
FLAT画像を見ればbadピクセル(感度悪い)が良く分かるのでmedianFLAT.fitsを使う。
(FLAT_Sp内にて)
・まずは[201:560,0:3800]の切り出し
longslit> imcopy medianFLAT.fits[201:560,0:3800] medianFLAT+.fits
・波長校正
$ cp -r ../COMP_Sp/database/ ./
longslit> transform medianFLAT+.fits calFLAT.fits fitnames=goodArc
(displayさせてみる)
longslit> display calFLAT.fits 1
・imexamなどでみるとbadピクセル以外は今無視している短波長以外カウントが3000以上であるのでカウントが3000以上のピクセルを1、3000以下のピクセルを0にすればmaskの出来上がり
longslit> cp calFLAT.fits mask.fits
longslit> imreplace mask.fits value=0 lower=INDEF upper=3000
longslit> imreplace mask.fits value=1 lower=3000 upper=INDEF
◎maskを天体画像にかける
(M307_Sp内にて)
$ cp ../FLAT_Sp/mask.fits ./
longslit> imarith cal160.fits * mask.fits mask_cal160.fits
longslit> imarith cal162.fits * mask.fits mask_cal162.fits
☆sky引き
横軸が波長になったことで二次元スペクトルまっすぐになったが、まだバックグラウンドのsky輝線などが残っている。これを除去する作業をbackgroundというタスクを用いて行う。
backgroundはある波長域(今はy)でカウントを空間ピクセル(今はx)の関数として関数フィッティングを行い残差を出力させるタスクであるが、その関数フィッティングから天体光がrejectされるように工夫すればsky引きと等価になるというロジックである。
longslit> epar background
I R A F
Image Reduction and Analysis Facility
PACKAGE = longslit
TASK = background
input = mask_cal160.fits Input images to be background subtracted
output = subsky160.fits Output background subtracted images
(axis = 1) Axis along which background is fit and subtracte #波長がlineに沿ってる場合は1、columnに沿っている場合は2#
(interac= yes) Set fitting parameters interactively?
(sample = *) Sample of points to use in fit
(naverag= 1) Number of points in sample averaging
(functio= spline3) Fitting function #フィッティングに使う関数#
(order = 2) Order of fitting function #今空間方向(x)にはflatであることが期待されるのでそんなに高次じゃなくていい#
(low_rej= 2.) Low rejection in sigma of fit #フィッティングからrejectする下限σ#
(high_re= 2.) High rejection in sigma of fit
(niterat= 1) Number of rejection iterations #clipping回数#
(grow = 0.) Rejection growing radius
(graphic= stdgraph) Graphics output device
(cursor = ) Graphics cursor input
(mode = ql)
(:go)
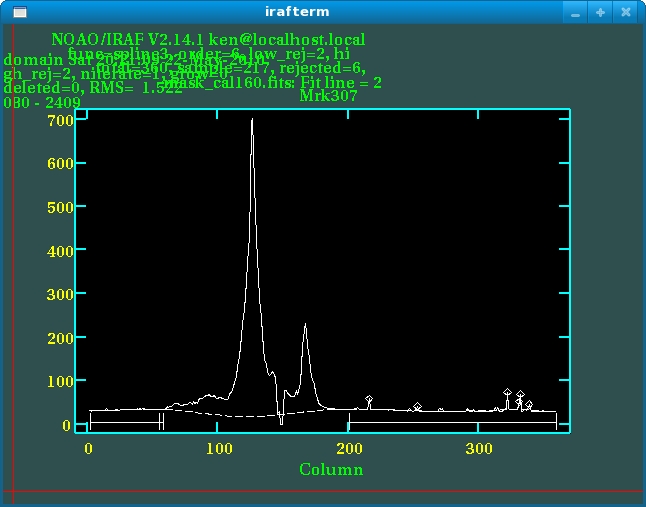
→最初にirafterm上でfit lineを聞いてくる。これは一定のy範囲で波長方向にスペクトルを平均しそこでskyフィッティングの仕方を決定し、そのy範囲においてはあらゆるyで同じ仕方でskyフィッティングを行う、ということである。なのでds9上でyがいくつからいくつまでだったら同じようなskyフィッティングを行っていいか考えてインプットする。例えば、自分は銀河の腕構造が見えてる2080~2409でまず行った。
mask_cal160.fits: Fit line= 2080 2409
すると以下のような画像が表示される
これは横軸=columnの空間方向のカウント値を示している。(ただしy=2080~2409の平均値)これとdisplayさせた画像を見比ると見るとx=0~60,200~360をskyとみなすことが妥当と思われるので、フィッティングもその範囲でのみ行いたい。
backgroundでは"s"を二回打つとその間の範囲を記憶してくれる。なのでx=0,60,200,360で計4回"s"を打ち、その上で"f"を打つとsky領域だけを用いた関数フィッティングがなされる。
また、":high_rej 3"、"niterat 2"などとうてば先に設定したオプションを変えれる
さて,y=2080~2409でのskyフィッティングの仕方がこれでいいと思えたら次のy範囲に移行する。
"q"と打つとまたFit lineを聞いてくるので次の範囲を指定する。自分は30~2080を指定した
cal160.fits: Fit line= 30 2080
前にsky領域だけを"s""s"で指定したのが残るので最初からその領域でのフィッティングになってるはず。いじりたかったらまたいじればいい。例えば今度はx=180~200もskyと考えられるのでそこも"s""s"でフィッティングに加えた
同様の作業をあとy=2410~3750でも行う。全部済んだら、Fit lineを聞いてきた時に"Enter"押せば終了できる。
・結果の確認
backgroundが上手く行っていればdisplayさせたときに空間方向全体に入っていたsky輝線が消えるはず
(同様の作業をmask_cal162.fitsにも行い、subsky162.fitsをつくる)
☆足し合わせ
sky引き済みのsubsky160.fitsとsubsky162.fitsを足し合わせることでS/N比向上と宇宙線イベントの除去を図る。
◎位置合わせ(もっと正確にやる方法があるはず・・・)
スペクトルの位置をまずは合わせないといけない。目測でsubsky160.fitsをx方向に+13だけシフトさせればsubsky162.fitsに重なる、と思う・・・
longslit> imshift subsky160.fits subsky160_shift.fits 13 0
longslit> display subsky160_shift.fits 1
longslit> display subsky162.fits 2
"Tab"連打
で位置があってることを確認する。
◎imcombine
$ ls subsky160_shift.fits subsky162.fits > subskylist
longslit> imcombine @subskylist med_subsky.fits combine=median reject=sigclip lsigma=3 hsigma=3
・結果表示
longslit> display med_subsky.fits 3 →こんな感じ
二枚しか画像がないのでこれが限界
☆一次元化(apall)
二次元スペクトルmed_subsky.fitsから天体光が写っている部分を抽出して一次元化する。元画像で確認する限りx=140付近の太いバンド(銀河中心の光のスペクトルと思われる)とx=181付近(星?銀河内の星形成領域?)が連続光持っているのでそこを一次元化する。
(パッケージはtwodspec.aextract)
longslit> bye
twodspec> ap
apextract> epar apall
I R A F
Image Reduction and Analysis Facility
PACKAGE = apextract
TASK = apall
input = med_subsky.fits List of input images
(output = mrk_multispec.fits) List of output spectra
(apertur= ) Apertures
(format = multispec) Extracted spectra format
(referen= ) List of aperture reference images #先に同じ抽出作業を行って入ればここにリファレンスとして入れることも可#
(profile= ) List of aperture profile images
(interac= yes) Run task interactively? #find以下のことをinteractiveに行いたいのでyes(一応)#
(find = yes) Find apertures?
(recente= yes) Recenter apertures?
(resize = no) Resize apertures?
(edit = yes) Edit apertures?
(trace = yes) Trace apertures?
(fittrac= yes) Fit the traced points interactively?
(extract= yes) Extract spectra?
(extras = yes) Extract sky, sigma, etc.?
(review = yes) Review extractions?
(line = INDEF) Dispersion line
(nsum = -1000) Number of dispersion lines to sum or median #デフォルトと変えたが大した意味はない#
# DEFAULT APERTURE PARAMETERS(「アパーチャー=抽出スペクトル」の幅の設定など)
(lower = -10.) Lower aperture limit relative to center #検出アパーチャーの幅を20ピクセルと考えて下は中心から-10ピクセル#
(upper = 10.) Upper aperture limit relative to center #上は+10日ピクセルまでとる#
(apidtab= ) Aperture ID table (optional)
# DEFAULT BACKGROUND PARAMETERS(バックグラウンド引きをapallで行う場合はここをいじる必要あり)
(b_funct= chebyshev) Background function
(b_order= 2) Background function order
(b_sampl= -100:-10,10:100) Background sample regions
(b_naver= -100) Background average or median
(b_niter= 0) Background rejection iterations
(b_low_r= 3.) Background lower rejection sigma
(b_high_= 3.) Background upper rejection sigma
(b_grow = 0.) Background rejection growing radius
# APERTURE CENTERING PARAMETERS
(width = 5.) Profile centering width
(radius = 10.) Profile centering radius
(thresho= 0.) Detection threshold for profile centering
# AUTOMATIC FINDING AND ORDERING PARAMETERS
nfind = 2 Number of apertures to be found automatically #自動で検出するアパーチャーの数。今回は2本取り出したいので2。#
(minsep = 5.) Minimum separation between spectra
(maxsep = 1000.) Maximum separation between spectra
(order = increasing) Order of apertures
# RECENTERING PARAMETERS
(aprecen= ) Apertures for recentering calculation
(npeaks = INDEF) Select brightest peaks
(shift = yes) Use average shift instead of recentering?
# RESIZING PARAMETERS
(llimit = INDEF) Lower aperture limit relative to center
(ulimit = INDEF) Upper aperture limit relative to center
(ylevel = 0.1) Fraction of peak or intensity for automatic widt
(peak = yes) Is ylevel a fraction of the peak?
(bkg = yes) Subtract background in automatic width?
(r_grow = 0.) Grow limits by this factor
(avglimi= no) Average limits over all apertures?
# TRACING PARAMETERS
(t_nsum = 10) Number of dispersion lines to sum
(t_step = 10) Tracing step
(t_nlost= 3) Number of consecutive times profile is lost befo
(t_funct= legendre) Trace fitting function
(t_order= 10) Trace fitting function order
(t_sampl= *) Trace sample regions
(t_naver= 1) Trace average or median
(t_niter= 0) Trace rejection iterations
(t_low_r= 3.) Trace lower rejection sigma
(t_high_= 3.) Trace upper rejection sigma
(t_grow = 0.) Trace rejection growing radius
# EXTRACTION PARAMETERS
(backgro= none) Background to subtract #sky引きを行うか否か?今回は行わないのでnoneだが、行う場合はfitで#
(skybox = 1) Box car smoothing length for sky
(weights= none) Extraction weights (none|variance)
(pfit = fit1d) Profile fitting type (fit1d|fit2d)
(clean = no) Detect and replace bad pixels?
(saturat= INDEF) Saturation level
(readnoi= 0.) Read out noise sigma (photons)
(gain = 1.) Photon gain (photons/data number)
(lsigma = 4.) Lower rejection threshold
(usigma = 4.) Upper rejection threshold
(nsubaps= 1) Number of subapertures per aperture
(mode = ql)
(:go)
(いやになる程オプションが多いがsky引きをするわけではないのでほとんどの所はデフォルトでいいはず)
とにかくapall実行すると以下のようにいろいろ聞いてくる
Find apertures for med_subsky? (yes):
アパーチャーを探すか?yesまたは"Enter"を打つ
Number of apertures to be found automatically (1):
アパーチャーの数は?1
Edit apertures for med_subsky? (yes):
アパーチャーをエディットするか? Yes
以下のようなiraftermが現れる
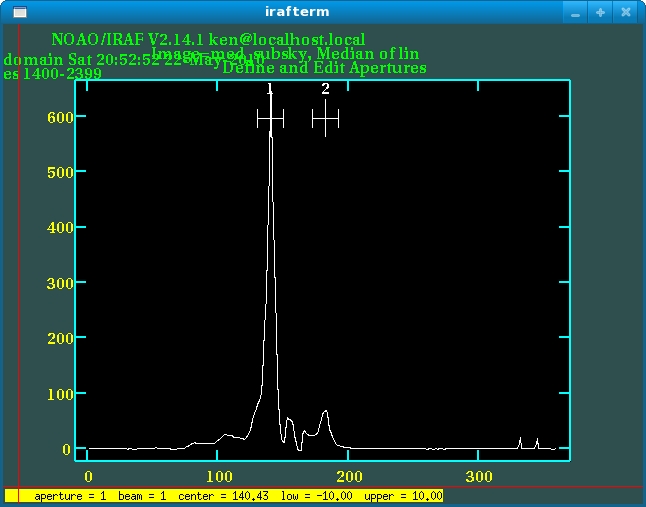
これはirafが自動で検出したスペクトル断面図とアパーチャーである。こっちのねらい通りのバンドをアパーチャーとして検出してくれているようなのでOK。"q"と打つ。
今度はirafterm上でいろいろ聞いてくる
Trace apertures for med_subsky? (yes):
アパーチャーをトレースするかどうか? Yes
Fit traced positions for med_subsky interactively? (yes):
トレースする場所をインタラクティブにフィットするかどうか? Yes
Fit curve to aperture 1 of med_subsky interactively? (yes):
当てはめる曲線をインタラクティブにフィットするかどうか? Yes
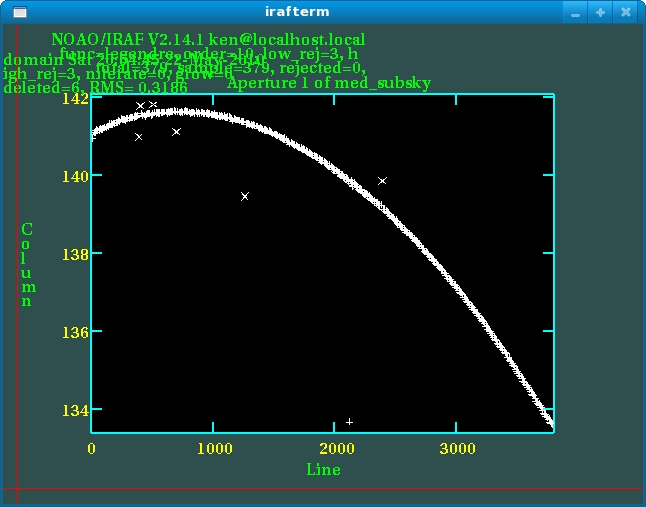
今度は下図のような横軸がline(波長方向軸)、縦軸がスペクトルのピークがあるcolumn座標の図が出てくる。点線は関数フィッティング(Legendre10次)
フィッティングから外れたデータは"d"で消して"f"で再度フィッティングしなおす
"q"で抜けると先に進む
Fit curve to aperture 2 of med_subsky interactively? (yes):
アパーチャー2についても同様のフィッティングを行う
Write apertures for med_subsky to database? (yes):
データベースにパラメータファイルを出力するか? Yes
Extract apertures spectra for med_subsky? (yes):
スペクトルを抽出するか? Yes
Review extracted spectra from med_subsky? (yes):
med_subskyから抽出したスペクトルを表示するか? Yes
Review extracted spectra for aperture 1 from med_subsky? (yes):
med_subskyから抽出したアパーチャー1のスペクトルを表示するか? no
以上で一次元スペクトルスペクトルが二つ分入ったfitsファイルmrk_multispec.fitsが出来た!
確認してみると
longslit> splot mrk_multispec.fits
Image line/aperture to plot (0:) (126): 1
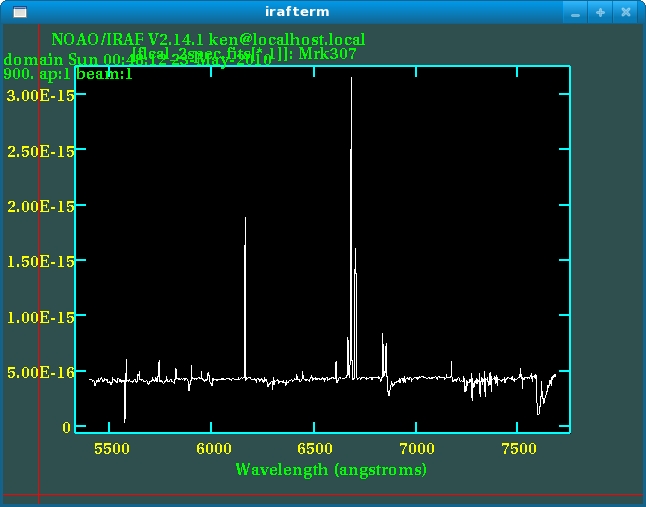
更にはじの方が嫌なので適当な波長域(5300~7500Å)だけ"a""a"で抜き出してやると→こんな感じ
同様にアパーチャー2の方もsplotさせてみると→こんな感じ
※ここで使ったapallコマンドはオプションが多く、正直自分もブラックボックス的に使った側面が大きいので参考になった資料をあげとく。「美星天文台 101cm 望遠鏡 IRAF による分光データ整約のすすめ」というのがweb上に落ちている(googleで"iraf 分光 美星"とでも検索すれば出てくる)ので、それの(12)あたりが参考になる。
☆標準星(G191B2B)を使ったflux-calibration
今できたmrk_multispec.fitsは縦軸がカウントでこれではフラックスや等級などの科学的情報引き出せない。また、flat-fieldingで補正できたのは空間方向の感度ムラだけであり、波長方向の感度ムラは依然残っている。
こうした二つの問題を一挙に解決してくれるのが以下に示す標準星を使ったflux-calibrationである。
先に具体的な作業手順を示すと
・標準星の一次元スペクトル化(BIAS引き、FLATわり、波長calibration、sky引き、一次元化)
↓
・観測標準星と本来のスペクトルの対応関係データ作成(standard)
↓
・感度曲線作り(sensfunc)
↓
・感度曲線を用いた強度校正(calibrate)
◎標準星スペクトルの整約(M307と同じ所は説明はぶく)
(以下STD_Sp/内で)
・BIAS引き、FLAT-fielding
$ cp ../BIAS_Sp/medianBIAS.fits ./
$ cp ../FLAT_Sp/normFLAT.fits ./
longslit> imarith FCSA00066182.fits - medianBIAS.fits subB_std.fits
longslit> imarith subB_std.fits / normFLAT.fits fl_std.fits
・object画像と同じく[201:560,0:3800]だけ切り出す
(そうすれば前に波長calibrationで作ったdatabaseそのまま使えるから)
longslit> imcopy fl_std.fits[201:560,0:3800] cor_flStd.fits
・波長calibration
$ cp -r ../COMP_Sp/database/ ./
longslit> transform cor_flStd.fits calStd.fits fitname=goodArc
・sky引き
longslit> backgr calStd.fits subskyStd.fits axis=1 interac=yes functio=spline3 order=2
上手くinteractiveにやる(objectと違ってそんなに難しくない)
・一次元化
longslit> bye
twodspec> ap
apextract> apall subskyStd.fits output=Std_spec.fits nsum=-100 lower=-10 upper=10 nfind=1 t_funct=legendre t_order=10 backgro=none
(今度はaperture1コでいい。あとはinteractiveを上手くやりすごす)
(◎邪魔な長波長側の端を削る)
今のところ一次元スペクトルはmrk_multispec.fitsとStd_spec.fitsの二つあるが、ともにsplotさせると一番長波長側の端がイカれてるのでこの段階で削っておく
具体的には3781~3801を削る
(STD_Sp内にて)
longslit> imcopy Std_spec.fits[1:3780] Std_spec+.fits
(M307_Sp内にて)
longslit> imcopy mrk_multispec.fits[1:3780,*] mrk_multispec+.fits
◎観測標準星と本来のスペクトルの対応関係データ作成(standard)
まず必要なG191B2B本来のスペクトルデータをすばる/FOCAS/User's manual/spectroscopy/standard starsのページからSTD_Sp/ディレクトリ内にダウンロードしてくる。(PlotではなくDataの方)
(STD_Sp/内で)
・standard
原理としては既知のスペクトルデータg191b2b.datと観測スペクトルStd_spec+.fitsの連続部を比較して、波長毎に本来のフラックスと観測カウントとの対応表を作る、ということである。
ただし、本来の標準星データのフォーマットは1行目から「波長、等級(AB)、バンドパス」となっている必要がある。また出てくる結果表の中のフラックスの単位はirafが勝手にerg/s/cm^2/Aにしており、最後までその単位で話が進むことも知っておいた方が良いだろう。
longslit> epar standard
I R A F
Image Reduction and Analysis Facility
PACKAGE = longslit
TASK = standard
input = Std_spec+.fits Input image file root name #インプットに入るのは必ず一次元スペクトル#
output = standard_table Output flux file (used by SENSFUNC
(samesta= yes) Same star in all apertures?
(beam_sw= no) Beam switch spectra?
(apertur= ) Aperture selection list
(bandwid= INDEF) Bandpass widths
(bandsep= INDEF) Bandpass separation
(fnuzero= 3.6300000000000E-20) Absolute flux zero point #等級→フラックス変換の際のzero点。m=-2.5LOG(F_nu/F_nu0)のF_nu0(単位はerg/s/cm^2/Hz)。AB等級で考える時は3.63E-20でいいはず(irafのデフォルトは3.68E-20だが・・・?)
(extinct= ) Extinction file #大気吸収の影響を補正する場合はここに観測所における大気透過特性ファイル入れたりする。#
(caldir = ./) Directory containing calibration data #標準星データファイルg1912b.datを置いた場所#
(observa= )_.observatory) Observatory for data #観測所に関する情報をここで与えられるが、そこまで細かいことは今回は気にしない#
(interac= yes) Graphic interaction to define new bandpasses
(graphic= stdgraph) Graphics output device
(cursor = ) Graphics cursor input
star_nam= g191b2b Star name in calibration list #標準星の名前#
airmass = 1. Airmass
exptime = 60. Exposure time (seconds) #airmassとexptimeがヘッダーにないときは必要になる#
mag = 11.78 Magnitude of star
magband = V Magnitude type
teff = DA1 Effective temperature or spectral type #mag,band,teff(星のスペクトル型)も普通は指定する必要ない#
answer = yes (no|yes|NO|YES|NO!|YES!)
(mode = ql)
(:go)
実行するといろいろ聞いてくるが全部デフォルトのまま進む。
No extinction correction applied
Std_spec+.fits(1): G191B2B
Star name in calibration list (g191b2b):
Std_spec+.fits[1]: Edit bandpasses? (no|yes|NO|YES|NO!|YES!) (yes):
すると下のようなiraftermが現れる
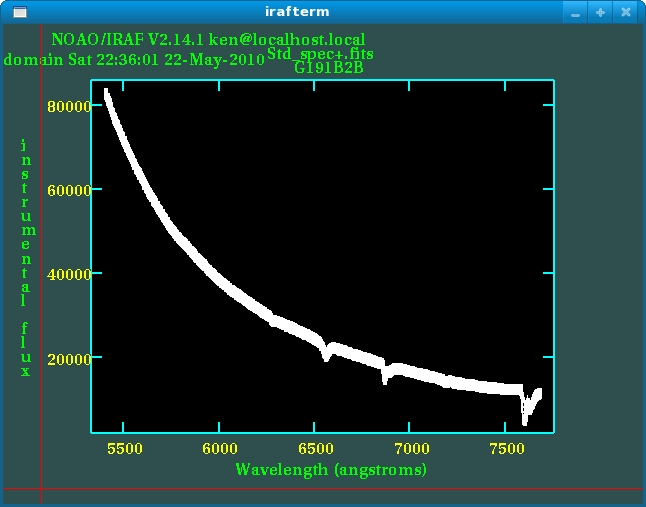
これは標準星データファイルにあるbandpass(波長幅)を観測スペクトルに重ねたもので、flux-calibrationに使うバンドパスをここで選ぶ。全部使えば良いというものではなく、吸収線やS/N比の悪い部分は使わない方が良い。
よってそういう使わない領域をズームして("z",ズームアウトは"p"),消していく("d")
最終的にはこんな感じ
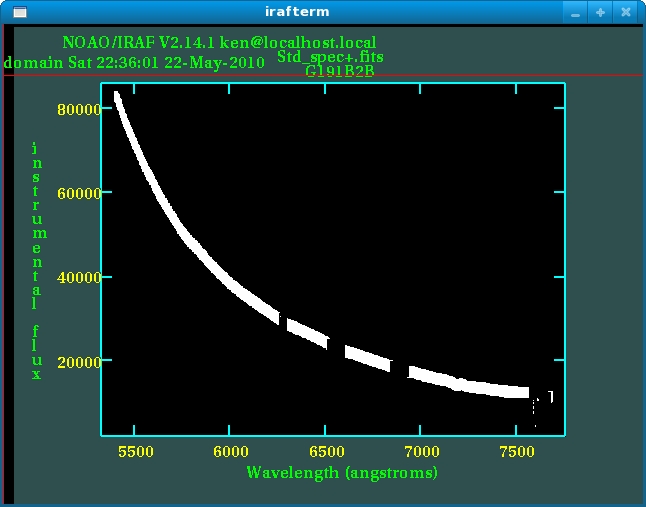
これで良ければ"q"でぬける
出力ファイルstandard_tableの中身を見ると
$ more standard_table
[Std_spec+.fits] 1 3780 60.00 1.235 5397.633 7690.778 G191B2B
5404.00 7.5318E-14 13.000 1775014.
5406.00 7.5262E-14 13.000 1772655.
5408.00 7.5137E-14 13.000 1768238.
5410.00 7.5081E-14 13.000 1763755.
5412.00 7.4888E-14 13.000 1757750.
5414.00 7.4833E-14 13.000 1751538.
5416.00 7.4777E-14 13.000 1746972.
5418.00 7.4585E-14 13.000 1742466.
・・・・・・・・・・・・
・・・・・・・・・・・・
・・・・・・・・・・
てな感じ。1列目から準に「波長、フラックス(本来の)、バンドパス、カウント(観測スペクトルの)」という並びになっている。
◎感度曲線の作成(sensfunc)
standardで作った標準星のフラックス-カウント対応表から、波長毎の感度を関数として与える(感度曲線をつくる)
longslit> epar sensfunc
I R A F
Image Reduction and Analysis Facility
PACKAGE = longslit
TASK = sensfunc
standard= standard_table Input standard star data file (from STANDARD) #インプットはstandardで作った対応表#
sensitiv= sensfunc Output root sensitivity function imagename #これで出力ファイルはsensfunc.0001.fitsになる#
(apertur= ) Aperture selection list
(ignorea= no) Ignore apertures and make one sensitivity functi
(logfile= logfile) Output log for statistics information
(extinct= )_.extinction) Extinction file
(newexti= extinct.dat) Output revised extinction file
(observa= )_.observatory) Observatory of data
(functio= spline3) Fitting function #感度曲線の関数形#
(order = 6) Order of fit #関数のオーダー#
(interac= yes) Determine sensitivity function interactively?
(graphs = sr) Graphs per frame
(marks = plus cross box) Data mark types (marks deleted added)
(colors = 2 1 3 4) Colors (lines marks deleted added)
(cursor = ) Graphics cursor input
(device = stdgraph) Graphics output device
answer = yes (no|yes|NO|YES)
(mode = ql)
(:go)
これで実行すると
Fit aperture 1 interactively? (no|yes|NO|YES) (no|yes|NO|YES) (yes):
と聞いてくるのでyesで通ると,次に下のようなirafterm現れる
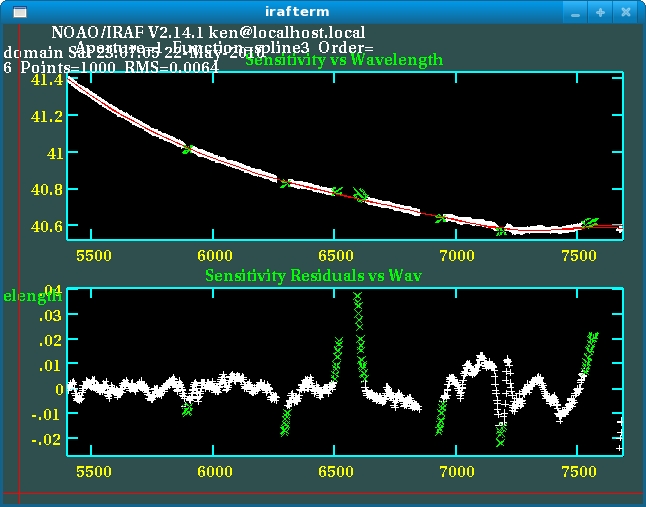
これは上が実際のバンドパス毎の感度とその関数フィッティングで、下がフィッテイングの残差を表示している。これを見ながらフィッティングから外したいプロットは"d"+"p"で消す(消されたプロットは緑色になる)。ある程度消したら再フィッテイング"f"。また関数のオーダーを変えたいときは":order 数"。最後に"q"で抜ける。
これで感度曲線sensfunc.fitsが出来た。splotでみてやると、短波長側ほど感度が高いことが分かる
◎感度曲線を用いて強度校正(calibrate)
実際に波長方向の感度ムラを補正してやる。
・まずは標準星スペクトルから
(STD_Sp内で)
longslit> epar calibrate
I R A F
Image Reduction and Analysis Facility
PACKAGE = longslit
TASK = calibrate
input = Std_spec+.fits Input spectra to calibrate
output = flcalStd_spec.fits Output calibrated spectra
(extinct= no) Apply extinction correction? #大気吸収補正は行わない#
(flux = yes) Apply flux calibration? #フラックス補正は行う#
(extinct= onedstds$kpnoextinct.dat) Extinction file
(observa= )_.observatory) Observatory of observation
(ignorea= no) Ignore aperture numbers in flux calibration?
(sensiti= sensfunc) Image root name for sensitivity spectra #ここに感度曲線の名前いれる(.0001.fitsの前でいい)#
(fnu = no) Create spectra having units of FNU? #やろうと思えば縦軸を単位周波数あたりのフラックスにすることも出来る#
(mode = ql)
(:go)
・確認作業
本当にフラックスcalibration出来たかどうかは作ったflcalStd_spec.fitsと元の標準星データg191b2b.datを比べて見ればわかる。
ただしg191b2b.datは等級しかないのでそれをフラックス(erg/s/cm^2/A)に直してやらないといけない。その方法はAB等級の場合は簡単でF_λ=(c/λ^2)*F_ν=(c/λ^2)*{F_ν0*10^(-0.4*mag)}=0.1089*10^(-0.4*mag)/(λ^2)で変換出来る。
なので以下のようにg191b2b_gnu.datを作ってgnuplotでプロットしてみる
$ awk '{print $1,$2,$3,0.1089*(10^((-0.4)*$2))/($1*$1)}' g191b2b.dat > g191b2b_gnu.dat
$ gnuplot
gnuplot> plot [5500:7500]"g191b2b_gnu.dat" u 1:4 w l →こんなの
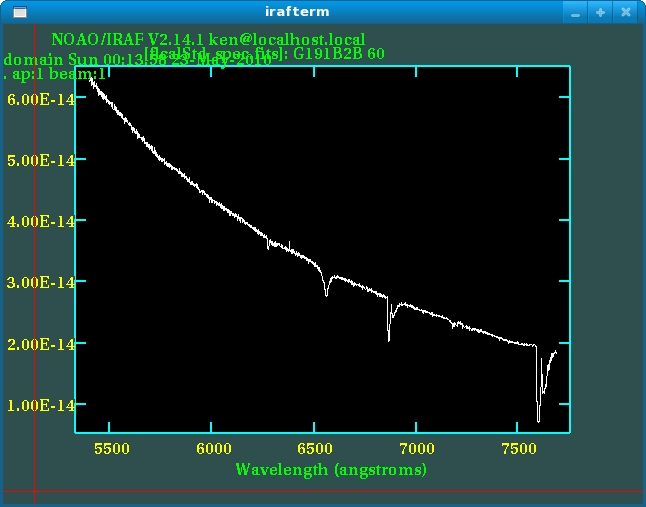
一方、今作ったflcalStd_spec.fitsを見ると
longslit> splot flcalStd_spec.fits
比べて見るとflux-calibrationした方が本来のスペクトルより0.5erg/s/cm^2/Aくらい暗くなってしまったことに気づく。原因は良く分からないが、今回はスペクトルの絶対値を問題にしようとは思っていないので大体これで良しとする。また全体の形状はあっているがあってはならない吸収線が見えたりもする。これは元画像
が一枚しかないことによる不安定性、またはsky引きが十分でなかったためかもしれない。
・Mrk307スペクトルもcalibrateしてやる
(M307_Sp内にて)
感度曲線はsensfunc.0001.fitsを使えば良いのでSTD_Sp/からコピーしてきてやる
$ cp ../STD_Sp/sensfunc.0001.fits ./
longslit> calibrate mrk_multispec+.fits flcal_2spec.fits flux=yes sensiti=sensfunc.0001 fnu=no ignorea=yes
☆結果の考察(splot)
出来たスペクトル(aperture1の銀河中心の方)を表示させてやると
longslit> splot flcal_2spec.fits
Image line/aperture to plot (0:) (1):1
さらに出てきたスペクトルを"s"+"3"で波長方向に3Aでスムージング
↓
Hα輝線(6562.8Å),[NII]輝線(6548,6584Å),[SII]輝線(6716.7Å),NaD吸収線などが確認できる。
Kゼミ目次に戻る


