2010.1/29
今日はカラーを測る。カラーは当然二色使わないといけないので、今まで使ってきたMOIRCS/Kバンド画像の他にHST/Rバンド画像を持ってきて等級の差をとる。
その際に二枚の画像間でいろいろ異なるので、その補正を行わないといけない。具体的には
→・位置合わせ・・・違う望遠鏡による画像なので、位置だけでなくピクセルスケール(視野の大きさ)も異なる。そうしたことまでふくめて二枚の画像内の天体の位置が合うようにする。
・PSF合わせ・・・HST/ACSの空間解像度はMOIRCSのものより全然良い。しかしカラーを測るにあたっては同じPSFでないと上手くないので、わざとHST/Rバンド画像のPSFをなます。
☆其の一 MOIRCS画像(K-band)とHST画像(R-band)の位置合わせ
◎HST/ACS Rバンド画像medcl0024R.fitsをとってくる
・まずは鍛冶澤先生のページからHST/ACS R-bandデータというのを取ってきて作業スペースに保存する。(7/9にすでにやったかもしれないが)
・とりあえず見てみる
cl> !ds9 &
cl> reset stdimage=imt8192
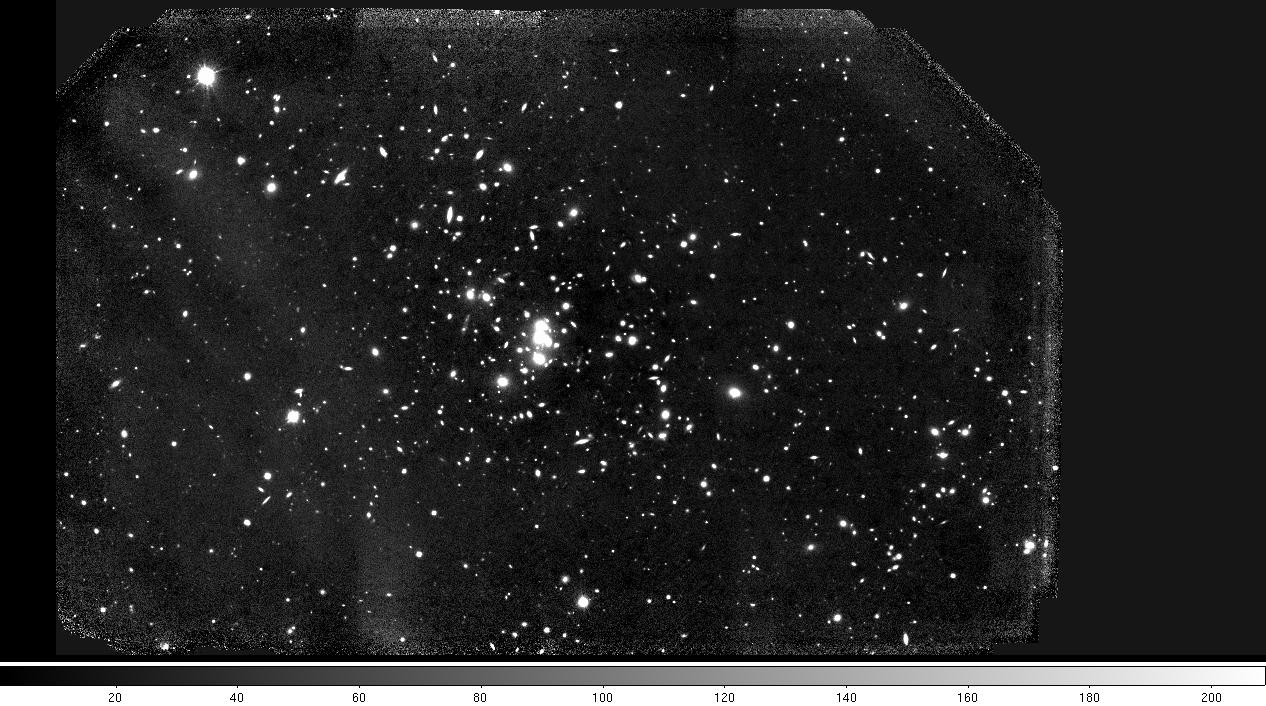
cl> display medcl0024R.fits 1 →こんなの
・フォーマットも調べる
cl> imhe medcl0024R.fits
medcl0024R.fits[4227,4358][real]:
→pixel scaleが小さいため視野は狭いが、フォーマットはデカい
・HST/ACSのAB-magでのzero点を調べる。
(これまでKバンド画像で使ってきた等級はVega等級だが後でAB等級に直すので、AB等級で話を進めていく)
http://www.stsci.edu/hst/acs/analysis/zeropointsより
HST/ACSのAB-magでのzero点は25.90667(mag)←ACS/WFC Zeropoints at -81 CのF625W
◎medcl0024R.fitsに対して天体検出をかける
・以下のような129R.sexおよび129R.paramというパラメータファイルを作る
→129R.sex
(WEIGHT_IMAGEは今expマップがないのでつけない)
129R.param
(NUMBER,MAG_APER,MAG_AUTO,X_IMAGE,Y_IMAGE,FLAGSだけコメントアウト)
・実行
$ sex medcl0024R.fits -c 129R.sex
segmentationファイルを見てちゃんと天体が検出されてるか見る
cl> display check.fits 2 zr- zs- z1=0.8 z2=1.2
・検出天体のリストを明るい順に並べ変え、明るい11番目から80番目までを新しくリスト化
$ sort -n -k 3 129R.cat | cat -n | awk '$1>16 && $1<87{print}' > 129Rselect.cat #$3がAuto mag。1〜6行は説明行なので省く#
◎だぶってる部分の天体だけを使って位置合わせ
領域をしぼるのはxyxymatchをコケにくくするためである
・HST/Rバンド画像の視野とだぶるMOIRCS/Kバンド画像の領域を見当つける
cl> display medcl0024R.fits 1
cl> display perfect1222.fits 2 zr- zs- z1=-20 z2=200
見比べてmedcl0024R.fitsの視野と重なるような、perfect1222.fitsの領域は大体
→[1100:2900,300:2200] (左端1100、右端2900、上端2200、下端300)
・MOIRCS画像の天体検出リスト112mag+.catからHST画像とダブってる領域の天体のみを抜きだし、明るい方の11番目から80番目をリスト化
ただし129Rselect.catと同じ並びになるようにNUMBER($1),MAG_APER($3),MAG_AUTO($4),X_IMAGE($5), Y_IMAGE($6),FLAGS($8)のみ抜き出す
$ awk '$5>1100 && $5<2900 && $6>300 && $6<2200{print $1,$3,$4,$5,$6,$8}' 112mag+.cat | sort -n -k3 | cat -n | awk '$1>10 && $1<81{print}' > 129Kselect.cat
→順に、番号,NUMBER,MAG_APER,MAG_AUTO,X,Y,FLAGSが入ったリスト二つ、129Rselect.catと129Kselect.catが出来た
・二つの画像の天体リストから、対応リストを作る。R-画像をK-画像に合わせるように
cl> epar xyxy
I R A F
Image Reduction and Analysis Facility
PACKAGE = immatch
TASK = xyxymatch
input = 129Rselect.cat The input lists
referenc= 129Kselect.cat The reference lists #リファレンスはMOIRCS/Kバンド画像に統一していく#
output = 129match.cat The output matched coordinate lists
toleranc= 3. The matching tolerance in pixels
(refpoin= ) Optional list of reference points
(xin = INDEF) X origin of input list
(yin = INDEF) Y origin of input list
(xmag = INDEF) X magnification required to match input to refer
(ymag = INDEF) Y magnification required to match input to refer
(xrotati= INDEF) X rotation required to match input to reference
(yrotati= INDEF) Y rotation required to match input to reference
(xref = INDEF) X origin of reference list
(yref = INDEF) Y origin of reference list
(xcolumn= 5) Input list column containing the x coordinate
(ycolumn= 6) Input list column containing the y coordinate
(xrcolum= 5) Reference list column containing the x coordinat
(yrcolum= 6) Reference list column containing the y coordinat #インプットとリファレンスそれぞれの5列目6列目がx,y座標に対応してる#
(separat= 9.) The minimum object separation
(matchin= triangles) The matching algorithm
(nmatch = 90) The maximum number of points for triangles algor
(ratio = 10.) The maximum ratio of longest to shortest side of
(nreject= 50) The maximum number of rejection iterations
(xformat= %13.3f) The format of the output x coordinate
(yformat= %13.3f) The format of the output y coordinate
(interac= no) Interactive mode ?
(verbose= yes) Verbose mode ?
(icomman= ) The image display cursor
(mode = ql)
(:go)
自分はこれで上手く行った(43 reference coordinates matched)
・天体対応表129match.catからR-画像をK-画像に合わせる変換規則129database.catを作る
cl> epar geomap
I R A F
Image Reduction and Analysis Facility
PACKAGE = immatch
TASK = geomap
input = 129match.cat The input coordinate files
database= 129database.cat The output database file
xmin = 1. Minimum x reference coordinate value
xmax = 5000. Maximum x reference coordinate value
ymin = 1. Minimum y reference coordinate value
ymax = 2848. Maximum y reference coordinate value #リファレンスのフォーマットは今しぼってあるのだが一応元の[1:5000,1:2848]にしとく#
(transfo= ) The output transform records names
(results= ) The optional results summary files
(fitgeom= general) Fitting geometry
(functio= polynomial) Surface type
(xxorder= 3) Order of x fit in x #x,y合わせを(3-1)=2次で行う#
(xyorder= 3) Order of x fit in y
(xxterms= half) X fit cross terms type
(yxorder= 3) Order of y fit in x
(yyorder= 3) Order of y fit in y
(yxterms= half) Y fit cross terms type
(maxiter= 50) Maximum number of rejection iterations
(reject = 3.) Rejection limit in sigma units
(calctyp= real) Computation type
(verbose= yes) Print messages about progress of task ?
(interac= no) Fit transformation interactively ?
(graphic= stdgraph) Default graphics device
(cursor = ) Graphics cursor
(mode = ql)
(:go)
・上で求めた変換規則129database.catを使ってR-画像を変換してやる
cl> epar geotran
I R A F
Image Reduction and Analysis Facility
PACKAGE = immatch
TASK = geotran
input = medcl0024R.fits Input data
output = Rperfect129.fits Output data #変換後の画像の名前#
database= 129database.cat Name of GEOMAP database file
transfor= 129match.cat Names of coordinate transforms in database file
(geometr= geometric) Transformation type (linear,geometric)
(xin = INDEF) X origin of input frame in pixels
(yin = INDEF) Y origin of input frame in pixels
(xshift = INDEF) X origin shift in pixels
(yshift = INDEF) Y origin shift in pixels
(xout = INDEF) X origin of output frame in reference units
(yout = INDEF) Y origin of output frame in reference units
(xmag = INDEF) X scale of input picture in pixels per reference
(ymag = INDEF) Y scale of input picture in pixels per reference
(xrotati= INDEF) X axis rotation in degrees
(yrotati= INDEF) Y axis rotation in degrees
(xmin = INDEF) Minimum reference x value of output picture
(xmax = INDEF) Maximum reference x value of output picture
(ymin = INDEF) Minimum reference y value of output picture
(ymax = INDEF) Maximum reference y value of output picture
(xscale = 1.) X scale of output picture in reference units per
(yscale = 1.) Y scale of output picture in reference units per
(ncols = 5000) Number of columns in the output picture
(nlines = 2848) Number of lines in the output picture #アウトプット画像のフォーマットはperfect1222.fitsに合わせておく#
(xsample= 1.) Coordinate surface sampling interval in x
(ysample= 1.) Coordinate surface sampling interval in y
(interpo= linear) Interpolant
(boundar= constant) Boundary extension (nearest,constant,reflect,wra
(constan= 0.) Constant boundary extension #余白がたくさん出来るがその部分のカウントは0に#
(fluxcon= yes) Preserve image flux?
(nxblock= 512) X dimension of working block size in pixels
(nyblock= 512) Y dimension of working block size in pixels
(verbose= yes) Print messages about the progress of the task
(mode = ql)
(:go)
これでperfect1222.fitsとの位置合わせが出来たRバンド画像=Rperfect129.fitsが出来たはず!
・出来た画像をdisplayさせて位置合わせされてるかチェック
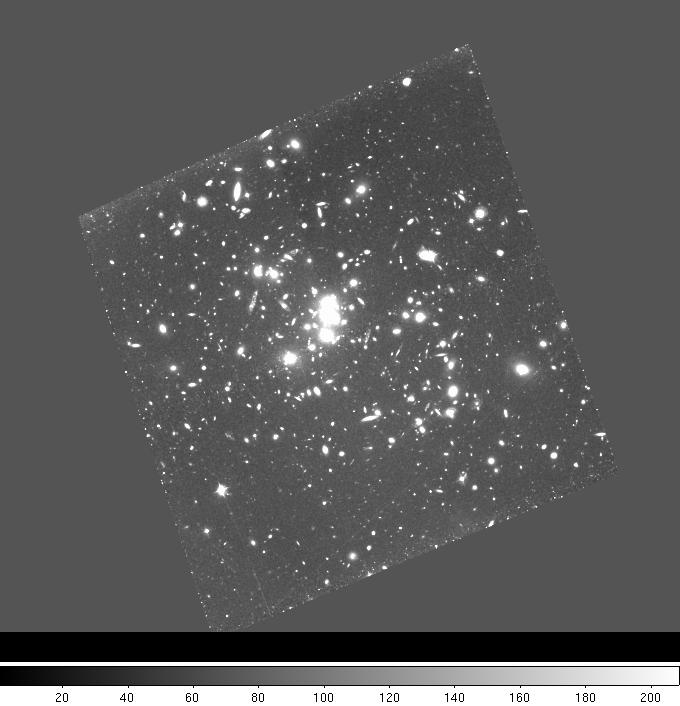
cl> display perfect1222.fits 1 zr- zs- z1=-20 z2=200 →こんなの
cl> display Rperfect129.fits 2 zr- zs- z1=-0.05 z2=0.1 →こんなの
Tab連打すればちゃんと位置合わせなされていることが確認できるはず。ちなみにこの位置合わせされたRバンド画像が目次に載せた画像である。
☆其の二 Rバンド画像のPSFをKバンド画像のそれに合わせる
今PSFについて
「PSF=点源のなまり具合=星のFWHM」
と考えているわけだが、それをどうやって変えるかを考えてみる。
MOIRCS/Kバンド画像の星のFWHMをFWHM_K,標準偏差をσ_K、HST/ACS/Rバンド画像の星のFWHMをFWHM_R,標準偏差をσ_Rとおく。σはFWHMとの関係(FWHM=2σ{2ln2}^0.5)から容易に求められる。例えばKバンド画像なら前回まででFWHM_K=4と分かっているので
σ_K=4/2/{2ln2}^0.5=1.699
という感じ
今、空間解像度が良いのでσ_Rの方がσ_Kよりも小さい。それを外的に強引になまらせることによりσ_R=σ_Kにしてしまう。
その外的ななましはiraf上のタスク"gauss"で行う。このタスクは「ガウス関数で画像をなまらせてしまう(畳み込み)」というもので、そのときの標準偏差をσ_filterとおくとこれを変えることで画像全体のσを変化させることができる。具体的には
σ_out={(σ_R)^2 + (σ_filter)^2}^0.5 という関係が成り立つ。
今回の場合σ_outをσ_K(1.7くらい)にしたいわけだから、gaussのsigmaとして
σ_filter={(σ_K)^2 - (σ_R)^2}^0.5={1.7^2-(σ_R)^2}^0.5
とすれば大体いいはず、というような見当がつく。
以下、具体的な作業を行っていく
◎Rperfect129.fitsのPSFを調べる
基本的には1/12にKバンド画像(perfect1222.fits)に対して行ったのと同じことをすれば良い。
・星の座標の可視化
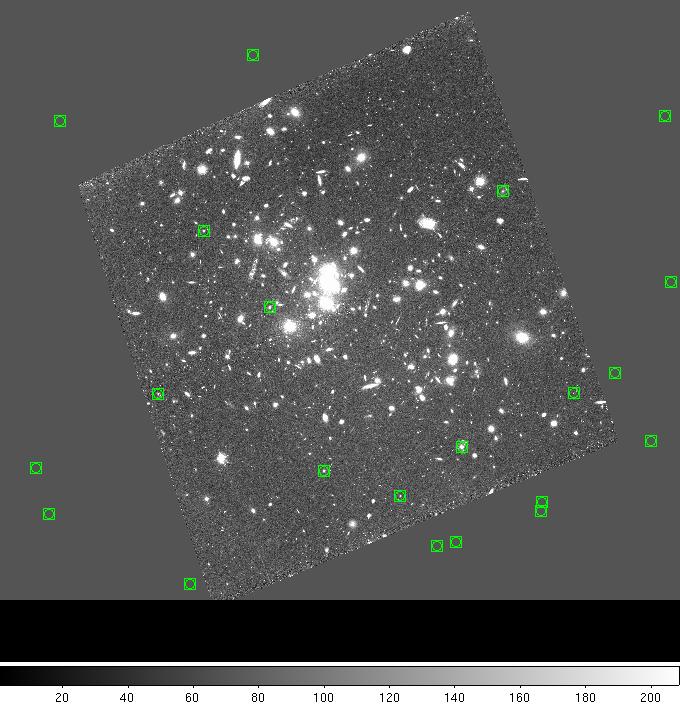
1/12に星の座標だけが入ったファイル112str.regを作っているのでそれをds9上で表示させる。(Rperfect129.fitsとperfect1222.fitsは位置合わせ済みなので問題ない)
ds9の上部で
Region→file format→XY
もう一回 Region→ load region → 112str.regを選択
で星可視化されるはず →こんな感じになるはず
・表示されてる星を狙ってimexam,aの連発(ただし目で見て明らかにおかしいものはとばす)
cl> imexam
# COL LINE COORDINATES
# R MAG FLUX SKY PEAK E PA BETA ENCLOSED GAUSSIAN DIRECT
1441.03 1476.79 1441.03 1476.79
2.84 19.98 101.6 0.00285 57.94 0.07 79 5.16 0.96 1.15 0.95
1258.87 825.60 1258.87 825.60
2.88 20.32 74.75 0.00665 41.56 0.11 -85 5.19 0.99 1.19 0.96
1922.02 516.39 1922.02 516.39
2.86 19.39 175.7 0.01037 101.1 0.12 -86 4.39 0.98 1.15 0.95
1704.57 1171.08 1704.57 1171.08
5.78 21.01 39.44 0.01575 5.266 0.25 84 13.4 1.81 2.03 1.93
1922.02 516.39 1922.02 516.39
2.86 19.39 175.7 0.01037 101.1 0.12 -86 4.39 0.98 1.15 0.95
2226.93 416.99 2226.93 416.99
3.04 20.56 59.78 0.00453 32.25 0.07 -64 1.60 0.92 0.97 1.01
2636.90 1634.98 2636.90 1634.98
4.33 21.24 31.88 0.00938 6.535 0.22 15 2.27 1.38 1.56 1.44
右3列がFWHM
→Rバンド画像での星のFWHMは大体1くらい(FWHM_R=1)
◎gaussなましの際のσ_filterの見当
・σ_Rの推定
FWHM_R=1より
σ_K=1/2/{2ln2}^0.5=0.425
・σ_filterの見当
今、σ_R=0.425,σ_K=1.7と分かったので、
σ_filter=(1.7^2-0.425^2)^0.5=1.65
◎Rperfect129.fitsをgaussianでなましてやる
上記で見積もったσ_filter=1.65を使えば必ず上手くいくというわけではなく、基本的にはtry & error!
・最初は見当付けた値sigma=1.65からスタートしてgauss行っていく
cl> epar gauss
I R A F
Image Reduction and Analysis Facility
PACKAGE = imfilter
TASK = gauss
input = Rperfect129.fits Input images to be fit #ガウスなましを行うインプット画像#
output = R_gauss129.fits Output images #なました後の結果画像の名前#
sigma = 1.65 Sigma of Gaussian along major axis of ellipse #σ_filter#
(ratio = 1.) Ratio of sigma in y to x
(theta = 0.) Position angle of ellipse
(nsigma = 4.) Extent of Gaussian kernel in sigma
(bilinea= yes) Use bilinear approximation to Gaussian kernel
(boundar= nearest) Boundary (constant,nearest,reflect,wrap)
(constan= 0.) Constant for boundary extension
(mode = ql)
(:go)
結果を見てみると
cl> display R_gauss129.fits 3 zr- zs- z1=-0.05 z2=0.1 →こんなの
・・・Rperfect129.fitsと比べればなまったのがよく分かるはず。
・perfect1222.fitsとR_gauss129.fitsで星のFWHMを比べる
(ds9上のRegion→Load Region...から前に作った星だけのファイル112str.regを選択しperfect1222.fitsとR_gauss129.fits上で星の場所を可視化しとく)
「ds9上で星の場所を狙ってimexam→aで星の広がり具合を見る」をR画像とK画像交互に行い比較
cl> imexam
# COL LINE COORDINATES
# R MAG FLUX SKY PEAK E PA BETA ENCLOSED GAUSSIAN DIRECT
1441.03 1476.78 1441.03 1476.78
12.22 19.92 108. 0.00122 5.31 0.03 5 13.3 3.79 4.12 4.07 #R画像#
1441.04 1476.70 1441.04 1476.70
11.27 12.02 156271. 1.779 6907. 0.07 -11 3.93 3.83 3.92 3.76 #K画像#
2636.88 1635.00 2636.88 1635.00
14.17 20.94 41.80 0.00186 1.214 0.19 45 5.66 4.68 4.78 4.72 #R画像#
2636.26 1635.17 2636.26 1635.17
13.32 13.08 58407. 6.576 1706. 0.16 33 2.52 4.41 4.49 4.45 #K画像#
1704.56 1171.08 1704.56 1171.08
14.71 20.80 48.06 0.0105 1.282 0.18 -89 4.96 4.87 4.98 4.90 #R画像#
1704.65 1171.07 1704.65 1171.07
13.64 12.76 78942. 1.856 2277. 0.15 -85 2.56 4.52 4.59 4.55 #K画像#
1258.89 825.58 1258.89 825.58
12.41 20.20 83.41 0.00121 3.844 0.22 -50 12.2 3.93 4.16 4.14 #R画像#
1258.45 826.19 1258.45 826.19
11.47 12.49 101122. 13.46 4432. 0.06 -23 3.21 3.87 3.90 3.82 #K画像#
1922.02 516.42 1922.02 516.42
12.36 19.31 188.9 0.0049 9.049 0.05 44 12.6 3.83 4.15 4.12 #R画像#
1922.05 516.44 1922.05 516.44
11.84 12.06 150314. 4.35 6269. 0.02 -18 3.89 3.96 4.04 3.95 #K画像#
・・・系統的にFWHM_R>FWHM_Kになってる→R画像なましすぎた。
・σ_filterを下げてやりなおし
この後はFWHM_R=FWHM_Kになるまでσ_filterを微調整しながらtry&errorの繰り返し
→最終的に自分はsigma=1.57で落ち着いたのでそれだけ示しておく
cl> gauss Rperfect129.fits R_gauss129+.fits sigma=1.57
cl> display R_gauss129+.fits 2 zr- zs- z1=-0.05 z2=0.1 →こんなの
cl> imexam
# COL LINE COORDINATES
# R MAG FLUX SKY PEAK E PA BETA ENCLOSED GAUSSIAN DIRECT
1441.04 1476.77 1441.04 1476.77
11.51 19.92 107.9 0.00124 5.803 0.02 0 12.7 3.64 3.94 3.84 #R画像#
1441.04 1476.70 1441.04 1476.70
11.27 12.02 156271. 1.779 6907. 0.07 -11 3.93 3.83 3.92 3.76 #K画像#
2636.87 1635.00 2636.87 1635.00
13.60 20.96 41.26 0.00227 1.299 0.18 45 5.44 4.50 4.58 4.53 #R画像#
2636.26 1635.17 2636.26 1635.17
13.32 13.08 58407. 6.576 1706. 0.16 33 2.52 4.41 4.49 4.45 #K画像#
1704.55 1171.08 1704.55 1171.08
14.17 20.80 47.69 0.01059 1.367 0.18 89 4.75 4.68 4.78 4.72 #R画像#
1704.65 1171.07 1704.65 1171.07
13.64 12.76 78942. 1.856 2277. 0.15 -85 2.56 4.52 4.59 4.55 #K画像#
・・・・・・・・・・・・・・・・・・・・・・・・・・・・・・・・・・・・・・・・・・・・・・・・・・・・
・・・・・・・・・・・・・・・・・・・・・・・・・(略)・・・・・・・・・・・・・・・・・・・・・・・・
・・・・・・・・・・・・・・・・・・・・・・・・・・・・・・・・・・・・・・・・・・・・・・・・・・・・
これくらいで良いと考えた。
一応これでperfect1222.fits(Kバンド画像)と位置合わせ、PSF合わせが出来たRバンド画像R_gauss129+.fitsが出来た!
☆其の三 color,R-Kを測る
perfect1222.fitsとR_gauss129+.fitsに対して測光を行い、等級差をとればカラー測ったことになる。
ただし二枚の画像で視野が違うことに注意。SExtractorの結果ファイルを見やすくするためにも、同じ視野(R_gauss129+.fitsの狭い視野)で天体検出を行いたい。
その目的の実現のためには、SExtractorのWEIGHT_IMAGEに視野をしぼったexposure mapをいれてやれば良いはずである。
◎視野の狭いHST/ACS画像の視野内のみの天体を扱うために、SExtractorのWEIGHT_IMAGEにいれるexposure mapの視野を狭くする
・とりあえずRperfect129.fitsの視野内のcountは1、その外は0の画像を作る
(フォーマットの問題上、medcl0024R.fitsからスタート)
cl> imcopy medcl0024R.fits preweight129.fits
imreplaceで視野内(というか画像全体)のpixelカウントを1にする
cl> epar imreplace
I R A F
Image Reduction and Analysis Facility
PACKAGE = imutil
TASK = imreplace
images = preweight129.fits Images to be edited
value = 1. Replacement pixel value
(imagina= 0.) Imaginary component for complex
(lower = INDEF) Lower limit of replacement window
(upper = INDEF) Upper limit of replacement window
(radius = 0.) Replacement radius
(mode = ql)
(:go)
(medcl0024R.fits→Rperfect129.fitsの時と同様の変換をかける)
epar geotran
I R A F
Image Reduction and Analysis Facility
PACKAGE = immatch
TASK = geotran
input = preweight129.fits Input data
output = pre_weight129.fits Output data #インプットとアウトプットを変えるだけ#
database= 129database.cat Name of GEOMAP database file
transfor= 129match.cat Names of coordinate transforms in database file
(geometr= geometric) Transformation type (linear,geometric)
(xin = INDEF) X origin of input frame in pixels
(yin = INDEF) Y origin of input frame in pixels
(xshift = INDEF) X origin shift in pixels
(yshift = INDEF) Y origin shift in pixels
(xout = INDEF) X origin of output frame in reference units
(yout = INDEF) Y origin of output frame in reference units
(xmag = INDEF) X scale of input picture in pixels per reference
(ymag = INDEF) Y scale of input picture in pixels per reference
(xrotati= INDEF) X axis rotation in degrees
(yrotati= INDEF) Y axis rotation in degrees
(xmin = INDEF) Minimum reference x value of output picture
(xmax = INDEF) Maximum reference x value of output picture
(ymin = INDEF) Minimum reference y value of output picture
(ymax = INDEF) Maximum reference y value of output picture
(xscale = 1.) X scale of output picture in reference units per
(yscale = 1.) Y scale of output picture in reference units per
(ncols = 5000) Number of columns in the output picture
(nlines = 2848) Number of lines in the output picture #アウトプット画像のフォーマットはperfect1222.fitsに合わせておく#
(xsample= 1.) Coordinate surface sampling interval in x
(ysample= 1.) Coordinate surface sampling interval in y
(interpo= linear) Interpolant
(boundar= constant) Boundary extension (nearest,constant,reflect,wra
(constan= 0.) Constant boundary extension #余白がたくさん出来るがその部分のカウントは0に#
(fluxcon= yes) Preserve image flux?
(nxblock= 512) X dimension of working block size in pixels
(nyblock= 512) Y dimension of working block size in pixels
(verbose= yes) Print messages about the progress of the task
(mode = ql)
(:go)
(変換されたがためにpreweight129.fitsで1だったcountがpre_weight129.fitsでは1でなくなってるため、1に直す)
cl> epar imreplace
I R A F
Image Reduction and Analysis Facility
PACKAGE = imutil
TASK = imreplace
images = pre_weight129.fits Images to be edited
value = 1. Replacement pixel value
(imagina= 0.) Imaginary component for complex
(lower = 0.1) Lower limit of replacement window #0以外のピクセル=視野内のカウントを0にするのがねらい#
(upper = INDEF) Upper limit of replacement window
(radius = 0.) Replacement radius
(mode = ql)
(:go)
これでつくろうとしていたRperfect129.fitsの視野内のcountは1、その外は0の画像ができたはず
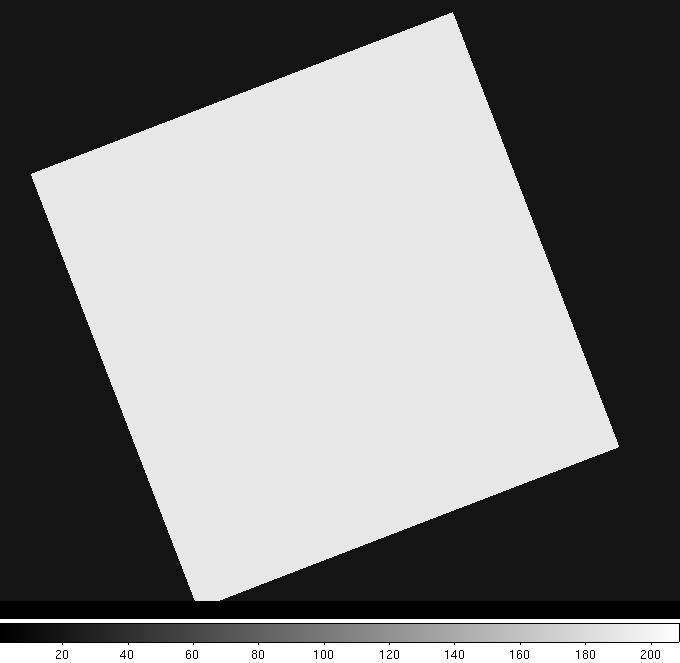
cl> display pre_weight129.fits 2 zr- zs- z1=-0.1 z2=1.1 →こんなの
更に確認してみると
cl> imstat pre_weight129.fits fields="min,max"
0. 1.
→OK
・以前までのexp1222.fitsのからRperfect129.fitsの視野内のみ切り出したものを作る
今作ったpre_weight129.fitsは視野内のカウントが1で視野外は0なのでこれをかければいいだけ
cl> imarith pre_weight129.fits * exp1222.fits exp129.fits
・確認
cl> display exp129.fits 3 →こんなの
◎exp129.fitsで重み付けして天体検出するSExtractorファイルをK-band用、R-band用の二種類作ってかける
・パラメータファイル作り
paramファイルは112mag1.paramの使いまわしでいいのでsexファイルのみ以下のようなものを作る
→129color_K.sex
129color_R.sex
(其の二でPSF合わせしたので、Apertureは4*2=8に統一しとく。WEIGHT_IMAGEはexp129.fits)
※注意・・・HST/ACSのzero点として使っている25.90667はAB等級だが、MOIRCSのzero点として前回まで使っていた29.785はVega等級。MOIRCSのzero点をAB等級に直さないといけない→今Kバンドなので+1.834すれば良い→29.785+1.834=31.619
・同じHST視野内の同じ天体に対してK-bandとR-bandの二種類で測光
SExtractorのW mode使って「検出はperfect1222.fits、測光はKバンド画像またはRバンド画像」
$ sex perfect1222.fits perfect1222.fits -c 129color_K.sex
$ sex perfect1222.fits R_gauss129.fits -c 129color_R.sex
・検出天体数が同じことを一応確認
$ wc 129color_K.cat
776 6202 56609 129color_K.cat
$ wc 129color_R.cat
776 6202 56609 129color_R.cat
◎R-Kを測る
・二つの検出天体リスト129color_K.cat,129color_R.catそれぞれの3列目がAperture magnitudeなので、同一天体に対してその差をとってやればカラーRーKになる
$ paste 129color_K.cat 129color_R.cat > 129R-K.cat
$ more 129R-K.cat
# 1 NUMBER Running object number
# 1 NUMBER Running object number
# 2 MAG_ISO Isophotal magnitude [mag]
# 2 MAG_ISO Isophotal magnitude [mag]
# 3 MAG_APER Fixed aperture magnitude vector [mag]
# 3 MAG_APER Fixed aperture magnitude vector [mag]
# 4 MAG_AUTO Kron-like elliptical aperture magnitude [mag]
# 4 MAG_AUTO Kron-like elliptical aperture magnitude [mag]
# 5 X_IMAGE Object position along x [pixel]
# 5 X_IMAGE Object position along x [pixel]
# 6 Y_IMAGE Object position along y [pixel]
# 6 Y_IMAGE Object position along y [pixel]
# 7 FWHM_IMAGE FWHM assuming a gaussian core [pixel]
# 7 FWHM_IMAGE FWHM assuming a gaussian core [pixel]
# 8 FLAGS Extraction flags
# 8 FLAGS Extraction flags
1 20.5002 20.9913 20.2111 1787.816 94.772 5.95 0
1 24.0112 24.7286 23.5568 1787.816 94.772 0.00 0
2 18.7785 19.4639 18.7107 1872.698 125.073 6.01 1
2 24.6722 99.0000 24.3173 1872.698 125.073 0.00 1
3 14.1359 14.8430 14.1513 2108.448 213.973 10.31 5
3 22.2513 99.0000 25.2817 2108.448 213.973 0.00 1
4 23.6475 23.2057 22.7597 1630.219 131.709 5.20 0
4 25.8246 25.3316 25.0014 1630.219 131.709 0.00 0
--続ける--(1%)
といった感じになる
後はこの129R-K.catのMAG_APER同士を引けば($11-$3)いいだけ
↓
↓
・gnuplotで可視化
$ gnuplot
K-magでのAuto_magを横軸、R-Kを縦軸にとってplot
gnuplot> plot [][-1:5]'129R-K.cat' u 4:($11-$3) →こんなの(epsファイル)
・・・やや右下がりぎみにプロットが集中してるのが分かる。これは明るいほど赤いという楕円銀河の特徴をよく示しており、この部分に該当する銀河が銀河団銀河と思われる!